
How to analyze sentiment over time
Chart sentiment and Siftsy Scores by day, week, or month to see how reactions change. You can add comment volume to the chart, and clicking any point shows the comments from that period.
Before you start
Open a collection, go to Analysis, and scroll to the Siftsy Score section of Comment Analysis.
Turn on the chart
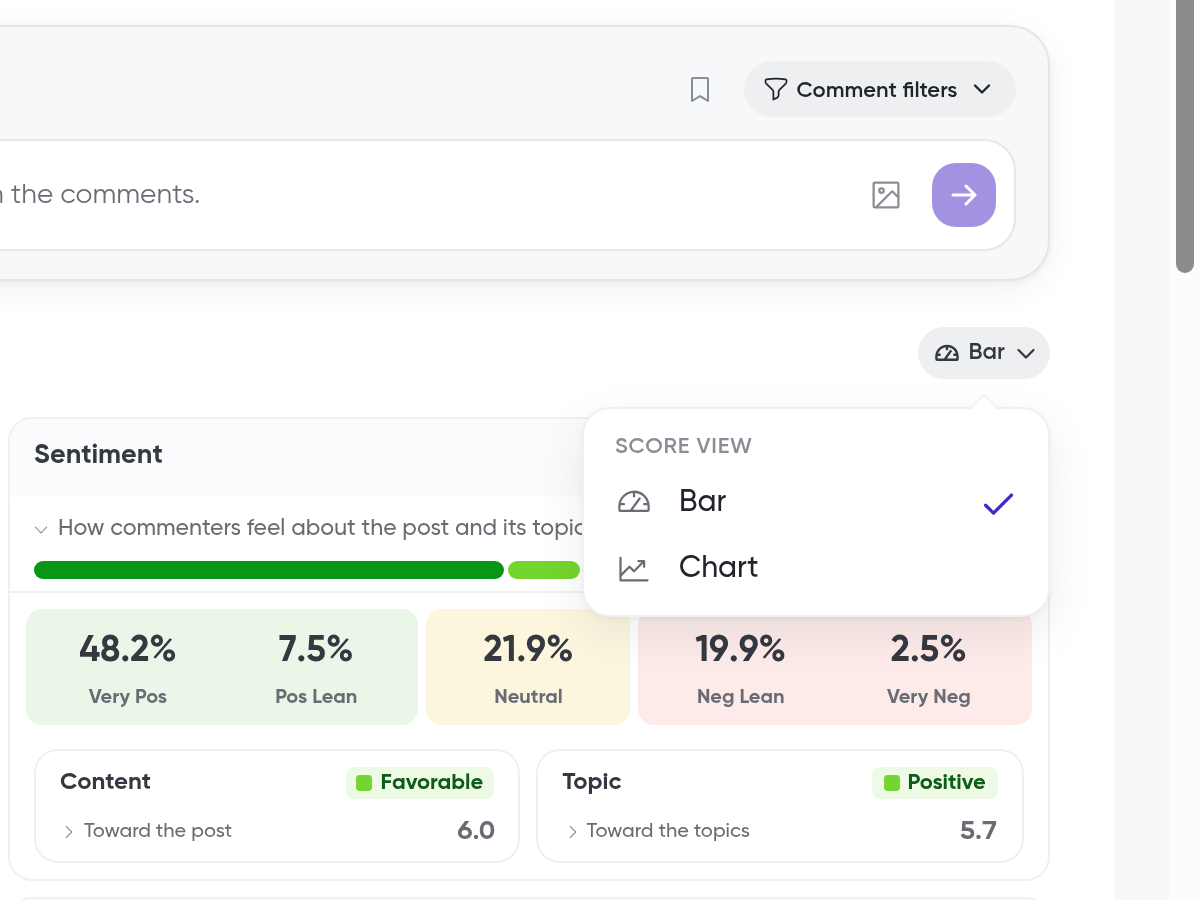
In the Siftsy Score section, click the score view button to open the Score View menu
Check Chart
You can keep Bar checked too. Both views can be on at the same time.
Change how the chart is grouped
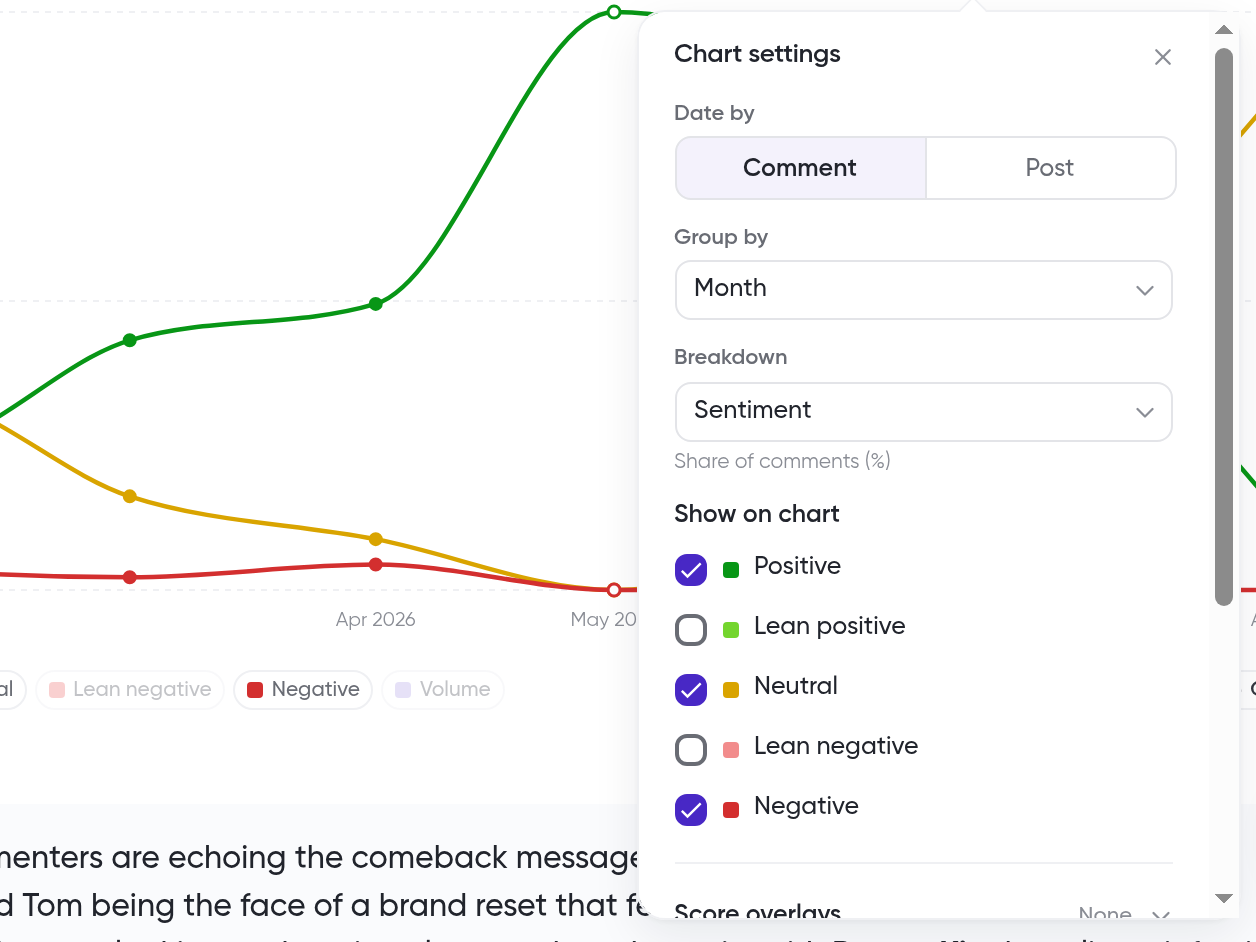
Click the settings summary above the chart (for example, Comment date · Month · Sentiment breakdown) to open Chart settings
Under Date by, choose Comment or Post
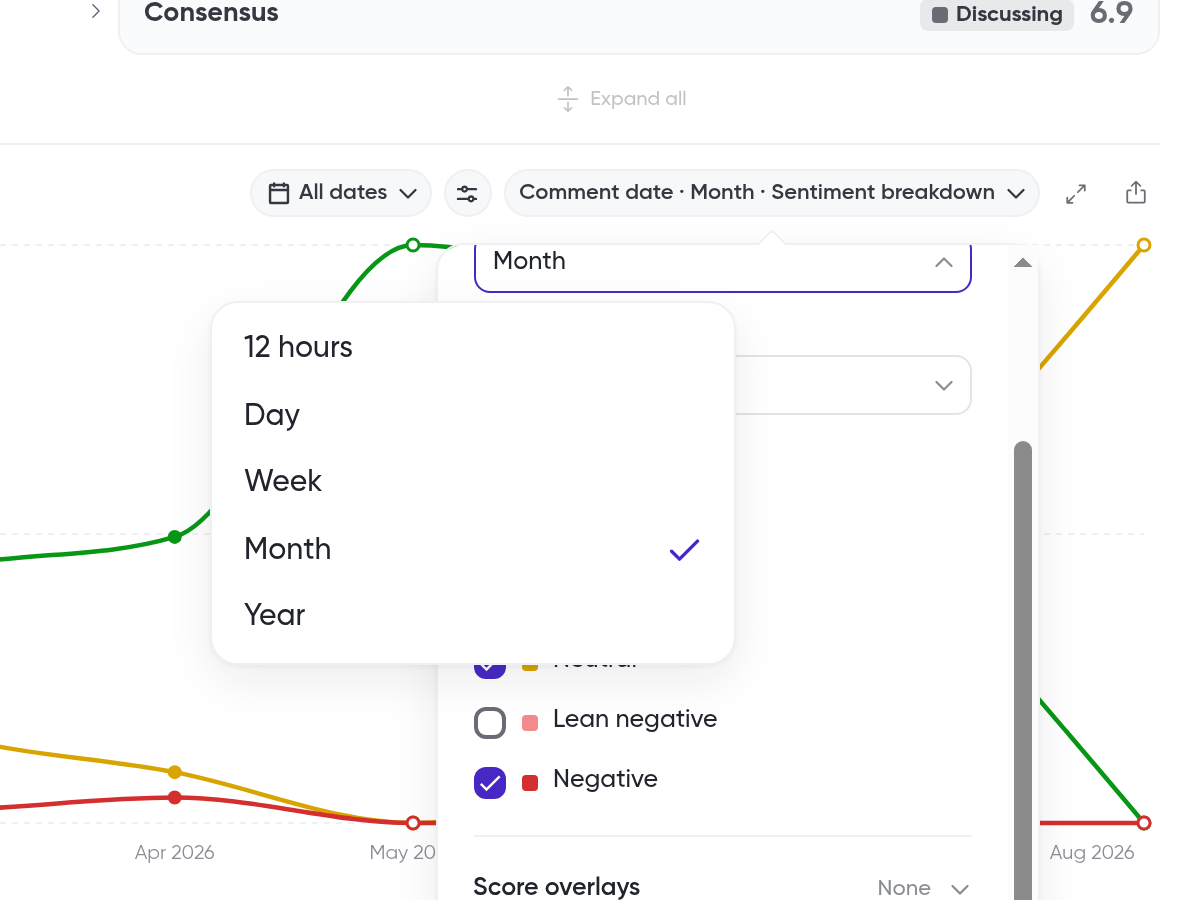
Under Group by, choose 12 hours, Day, Week, Month, or Year
Under Breakdown, choose Sentiment, Content, Topic, Relevance, Consensus, or None (Siftsy Score)
Breakdowns are shown as Share of comments (%)
Under Show on chart, check the sentiment levels you want to plot
Optionally, set Score overlays, turn on Show comment volume, or set Highlight From/To to shade a date range
Highlighting shades dates on the chart without filtering them. You can also drag across the chart to highlight a range.
You can also switch between comment date and post date from the toggle next to the chart legend (Switch to post date). Use All dates in the chart toolbar to set the date range.
Add comment volume
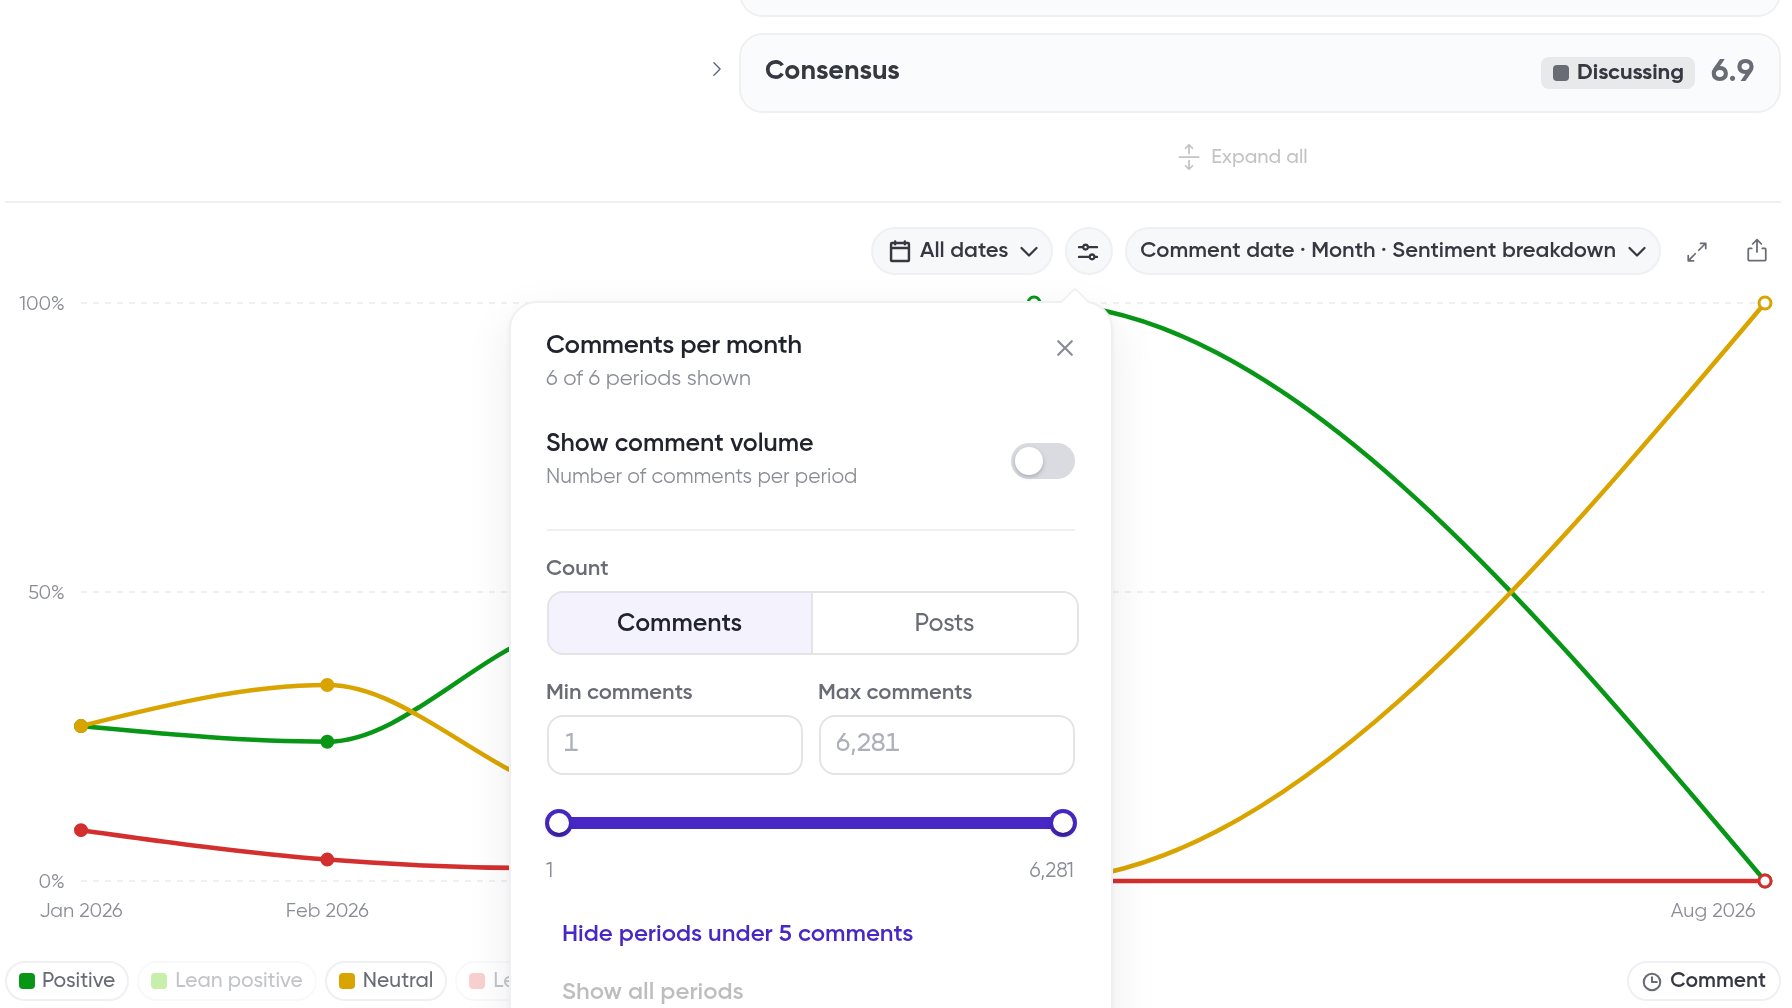
Click the volume icon in the chart toolbar
Turn on Show comment volume
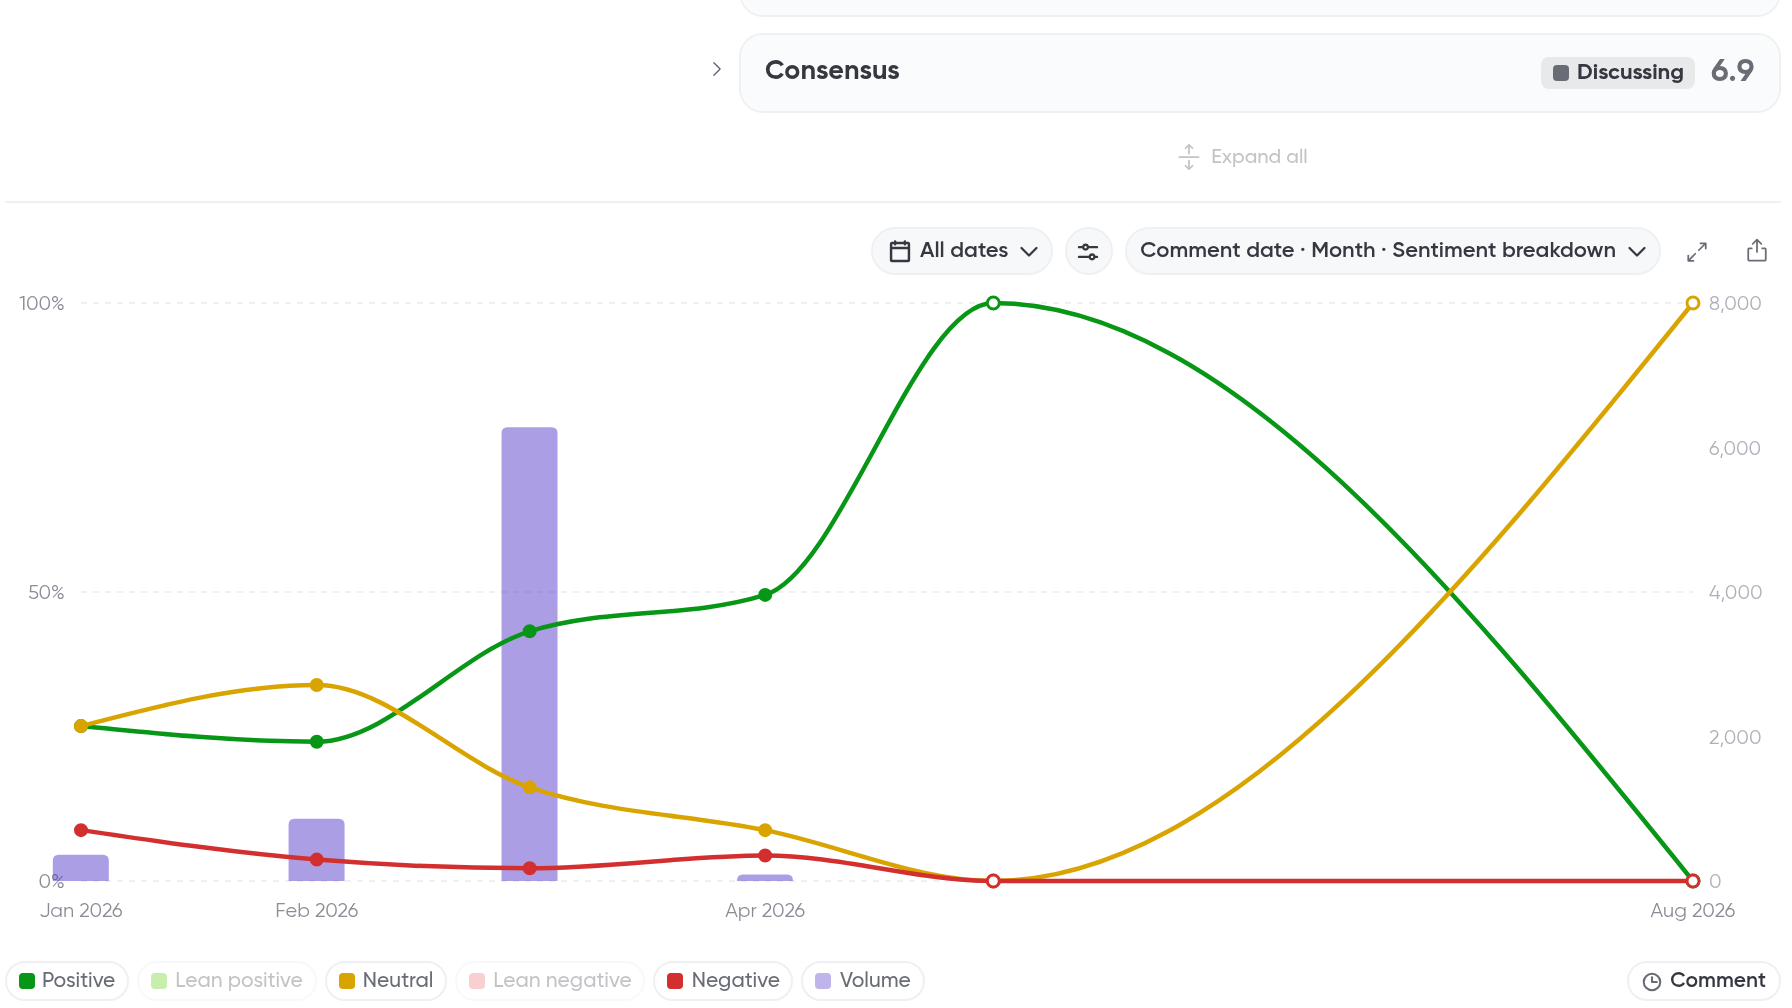
Volume shows the number of analyzed comments in each period, drawn as bars on the right axis
Optionally, choose whether to count Comments or Posts, adjust the Min/Max comments slider, or check Hide periods under 5 comments. Use Show all periods to reset
See the comments from a period
Hover over any point on the chart. You'll see Click for period details · Drag to highlight
Click the point to open the period card
The card shows the period and comment count (for example, Feb 2026 · 862 comments), plus SCORE, SENTIMENT, VOLUME, and the dominant sentiment share
Click the search button on the card (for example, Search Neutral comments from this period)
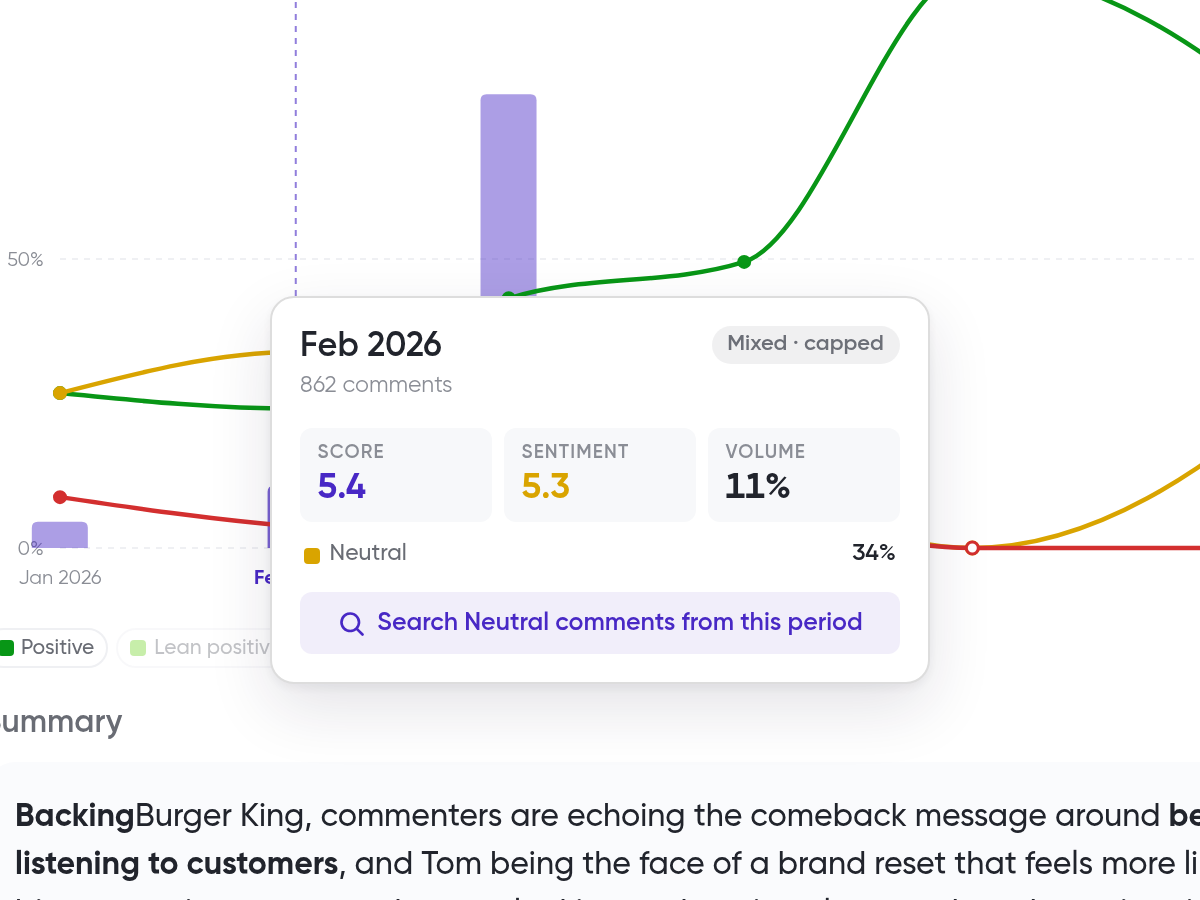
A new search tab opens with filters already applied, for example Sentiment: Neutral and Comment date: Feb 2026.
Full screen and export
Click Open chart full screen to view the chart in a larger Scores over time dialog
Click Export over time to export the chart data
What's next
Drill into the periods you highlight with the filters in How to filter comments, and sort the results with How to sort comments by timestamp.